When you first dive into machine learning, you'll come across a topic called linear regression. But what exactly is linear regression in machine learning and how is it used? That's exactly what I will explain in this post. So let's begin.
You Need The Basics
First of all, before we begin, you need to know some basic concepts about machine learning. I go over the knowledge you will need in one of my previous posts. Once you understand the basics of machine learning, you will have a much better grasp on what I will explain in this post.
Finding A Trend
Let's say you have a bunch of data points plotted on a graph showing the relationship between the number of ads you have out on the internet and your sales. You can clearly see a general direction where the points are all heading to as your number of ads increase.
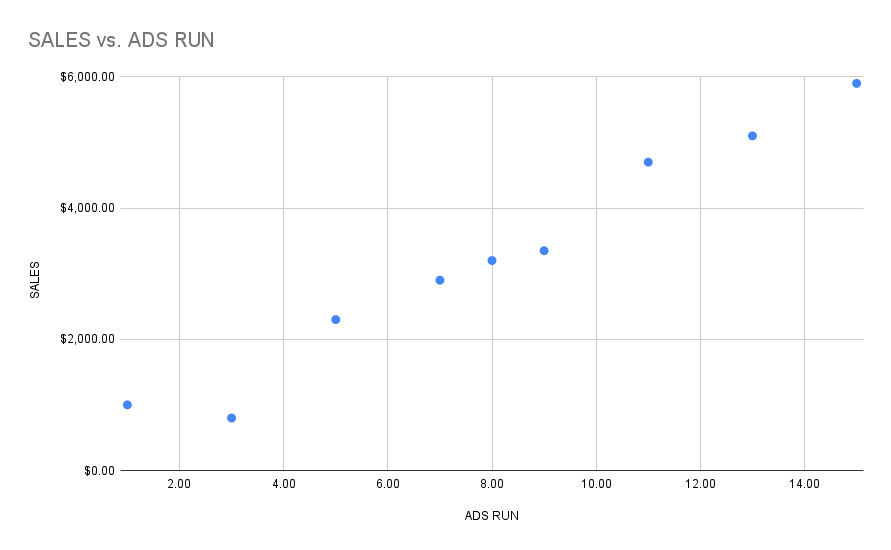
Now, you would very much like a way to predict or approximate what your sales would be if your ads increased to a certain number. Maybe if we drew a line through all the points that "best-fits" the data, we could have a pretty reliable way to predict what our sales would be at a certain number of ads. So how exactly would we do that?
Remember All Those Useless Equations You Learned In Math Class?

Well, not all of them are useless. Remember that equation you learned in Algebra, y = mx + b? We are finally going to put it to use. Instead of doing mindless Algebra like your teacher probably wanted you to do, we will actually use this equation in machine learning.
So, let's draw a line through our data points and see what our graph looks like. We figure out the line that best-fits our plotted points by using the least squares method.
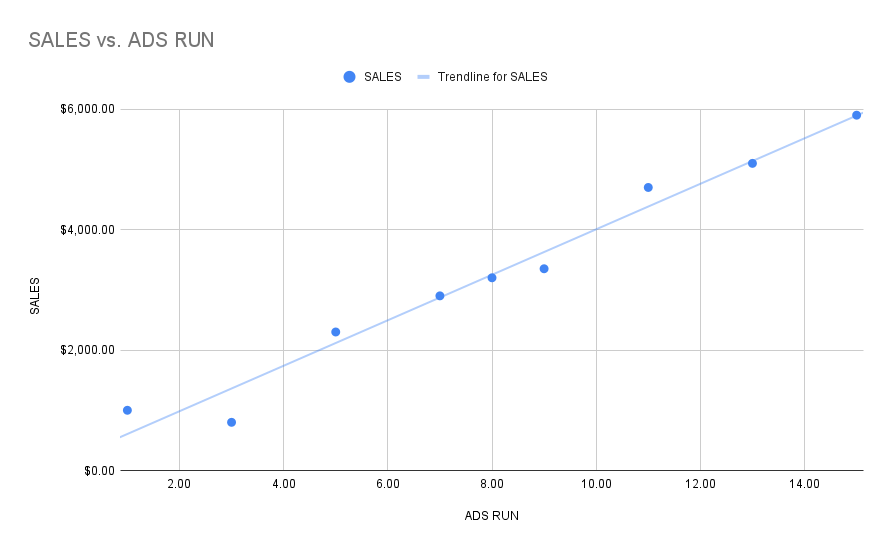
Nice! Now we can use the equation for a line that we learned Algebra to predict what our sales will be if we run a certain number of ads. Instead of y = mx + b, we use the equation below:

This is the same equation as y = mx + b; however, we are just using different variables, which mean the same thing. Let's note a couple of things about both of the equations just so we can see how they represent the same things just with different variables. Let's start with y = mx + b.
yis the sales we make for the number of ads we run. It is also the dependent variable.mis the slope or rate of change.xis the number of ads we are running. It is the independent variable.bis the y-intercept.
Now, let's look at y' = b + w1x1:
y'is the predicted value or label for a given input.bis the bias, which is also the same thing as the y-intercept.w1is the weight of feature 1, which is the same thing as the slope of a line.x1is the feature or a value that we are given and can insert into the function.
Now, you might be a little confused about what exactly the term "weight" means in machine learning. Each weight belongs to a feature, and you can basically think of the weight as how important a specific feature may be in predicting the label or output of a model. So, the higher the weight of a feature, the more importance it has in determining the final result of a model and vice versa. Moreover, we have only seen an equation with one feature so far just to keep things simple, but you may have a model with multiple inputs or features all with varying weights. Here is an example of a model that has two features:

Also, what exactly is the bias in this equation? It’s basically the “base level” where we start our predictions from. For example, when you are first born into this world, your health care expenses never start at $0 at year 0 of your life. Instead, they start at some price, and it typically goes up with age. So at year 0 of your life, your health expenses may be only $1000.
If we plot a graph showing the relationship between your age and health care expenses and assume a linear relationship within the data, we can see that our bias (same thing as the y-intercept) will be $1000. So that’s what bias means in linear regression, but there are other types of bias in machine learning that are a whole other topic, which I will discuss in future posts.
What Is Loss?
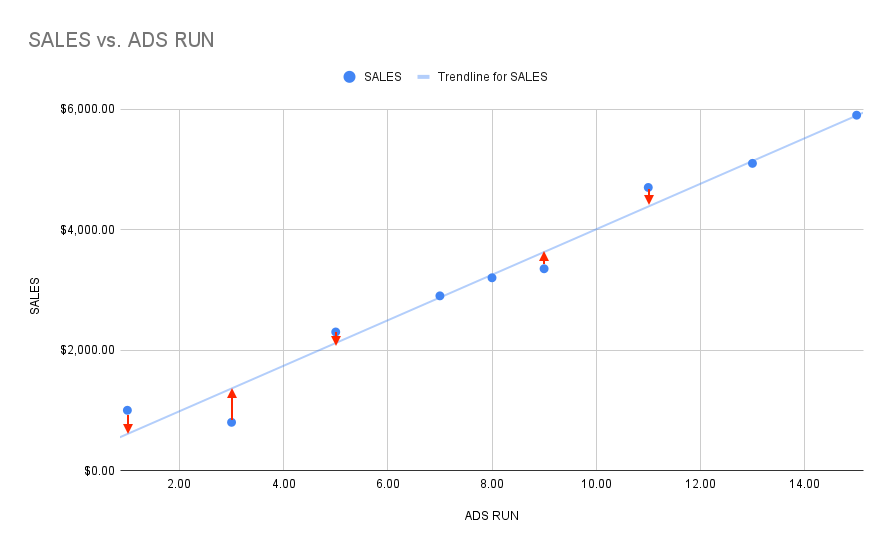
Now that we have got some of the basics out of the way and we know the equation for a line, we can talk about about this concept in machine learning called loss. Now what exactly is it? Put simply, loss is basically a number that tells how wrong the model's prediction was on a single example. If the model gives us a flawless prediction, the loss is zero; however, if the model gives us a prediction that is not the same as the actual answer for a given input, then the loss will be greater than zero. Moreover, you can see a visual representation of loss in the graph above. The red distance between the line and the actual "correct" data point is the loss.
The goal in machine learning is to reduce our loss as much as possible so that our model has the ability to give us pretty accurate predictions. We do this by training our model with a set of weights and biases that will result in our model giving us a low loss.
Conclusion
Congratulations on completing this lesson! In conclusion, we have learned about linear regression and loss in machine learning. We saw that linear regression is simply drawing a best-fit line through a bunch of data points and that loss is simply a numerical measure of how incorrect a model's prediction is. If you enjoyed this lesson, sign up for any new posts by putting your email in the form below, and let me know if you have any questions in the meantime!